Microsoft 365 Admin Center
Performance Monitoring
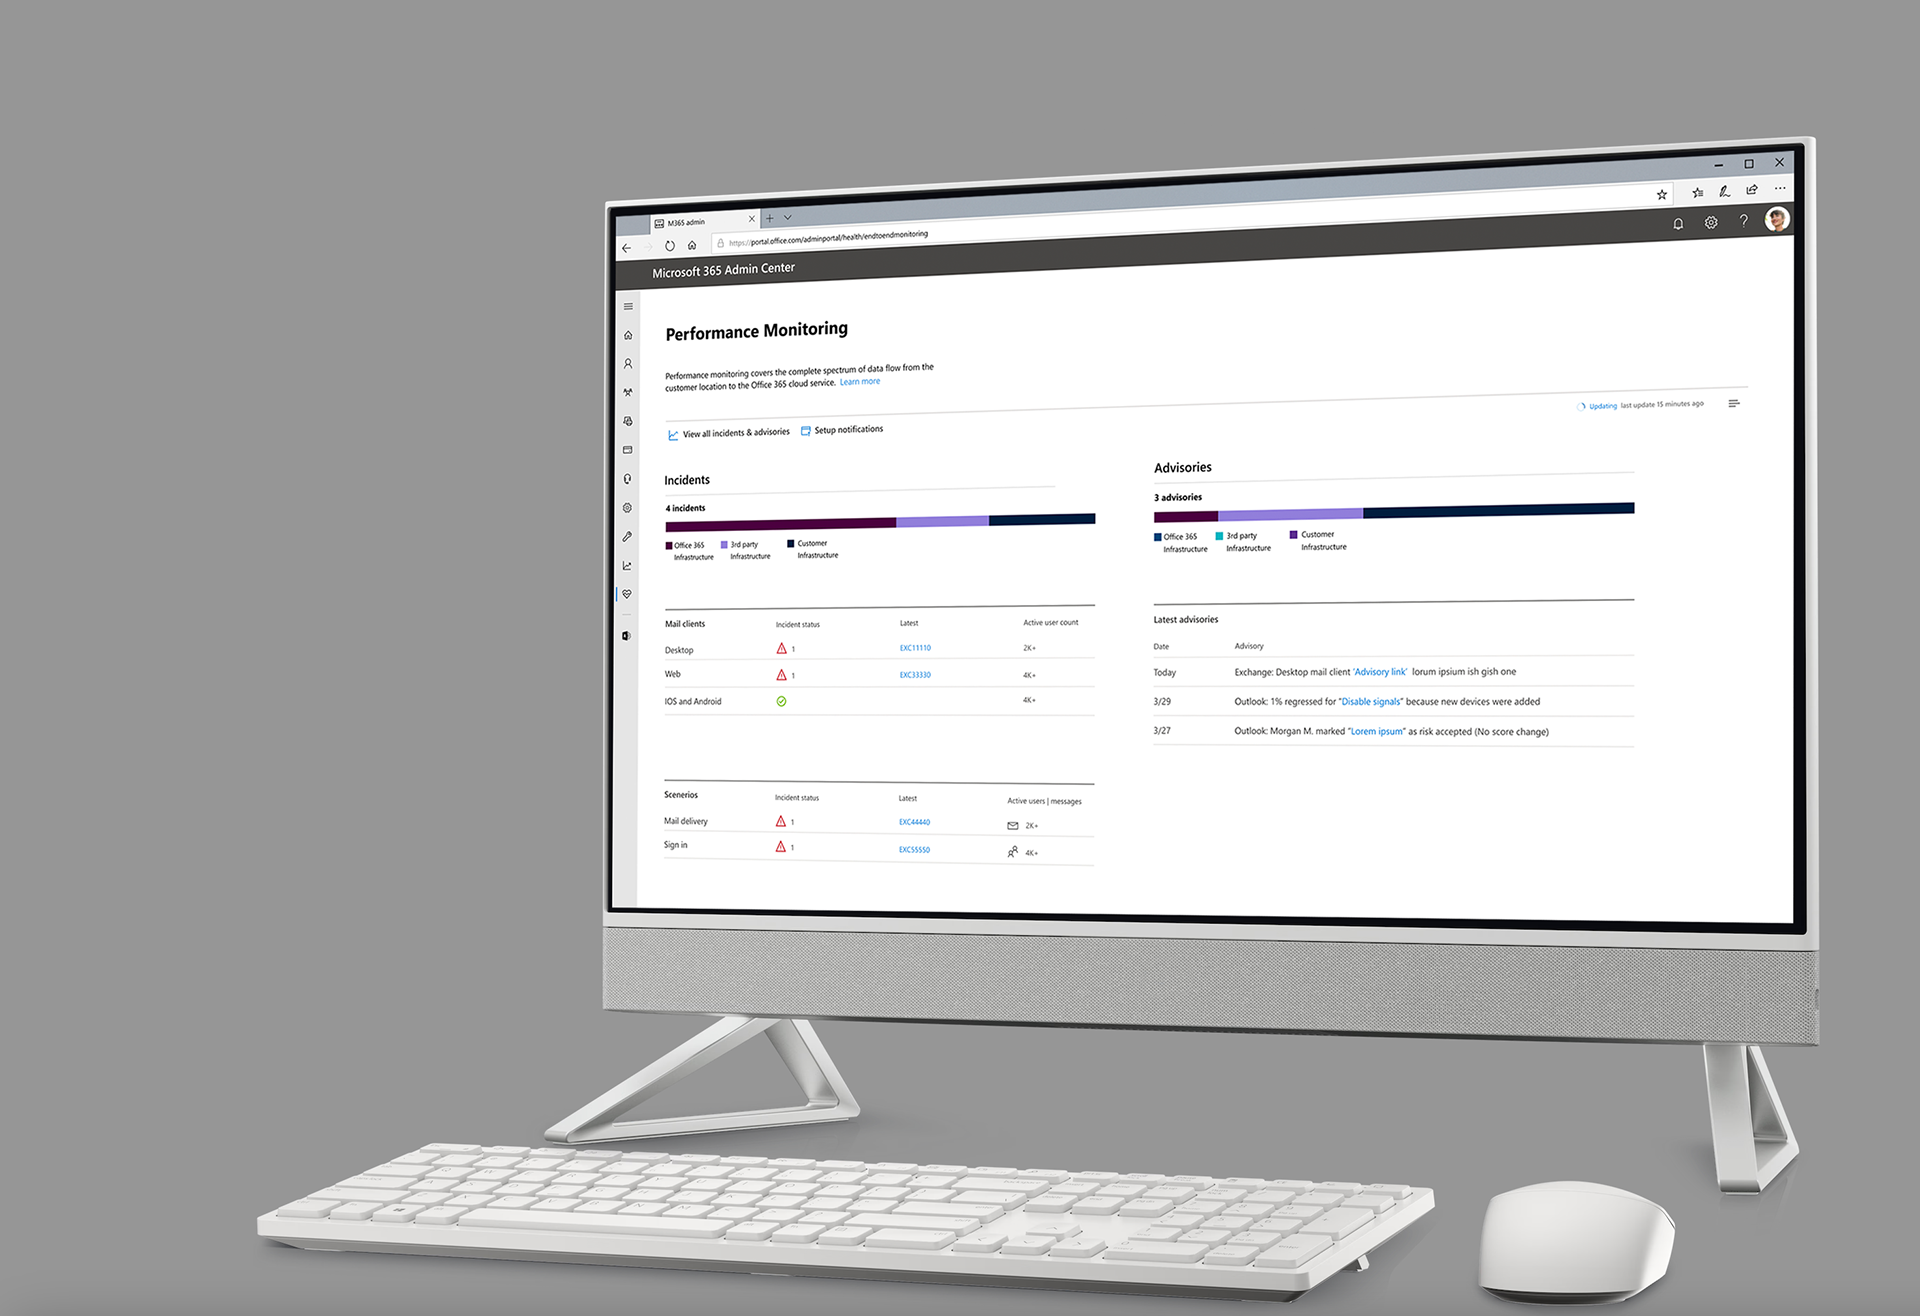
An investigation can still be open when an admin needs to act. I designed the V1 monitoring experience to help admins understand affected infrastructure, interpret impact through charts and timelines, and use machine-learning-informed recommendations within the incident details.
What shipped
Performance Monitoring brings incidents, advisories, and impact information into one tenant-facing view. The aim was to help admins understand an issue, assess who might be affected, and find the next action within the console they already use.
The work included tenant and VIP research, iterative prototypes, user feedback, and collaboration with the M365 Creative Studio. A central focus was the day-to-day incident scenarios: what information admins needed and how they would use a recommendation to manage the issue.
Why this product exists
Admins needed to make sense of tenant-level issues and Microsoft-level incidents while an investigation was still developing. Information was spread across status pages, email, and team knowledge. The design brought that context closer to the incident and distinguished actions the tenant could take from repair work handled by Microsoft.
The hardest design work was connecting the recommendation to the admin’s actual situation. VIP research focused on how incident details could support a practical response, with enough infrastructure context to make the next step understandable.
What is happening, who is affected, and what can I do next?
What I owned
- End-to-end product design for the V1 monitoring surface — overview, incident cards, advisories, and impact charts.
- Tenant and VIP research, followed by clickable prototypes of investigation states and transitions.
- Data-visualization design for affected-user counts, impact duration, and historic timelines, with overview and detail views for investigating an incident.
- The interaction model for investigation: status-aware actions, notification channels, and Outlook-native crash signals.
- Collaboration with the M365 Creative Studio and Outlook team on the monitoring and client experiences.
Machine learning behind the recommendations
AI in this project meant machine learning applied to monitoring data. Signals about Exchange, packet traffic, and data loss across Microsoft and third-party infrastructure informed impact estimates, scenario predictions, and advisories. My design work focused on making the resulting information and recommendations usable in the investigation flow.
01
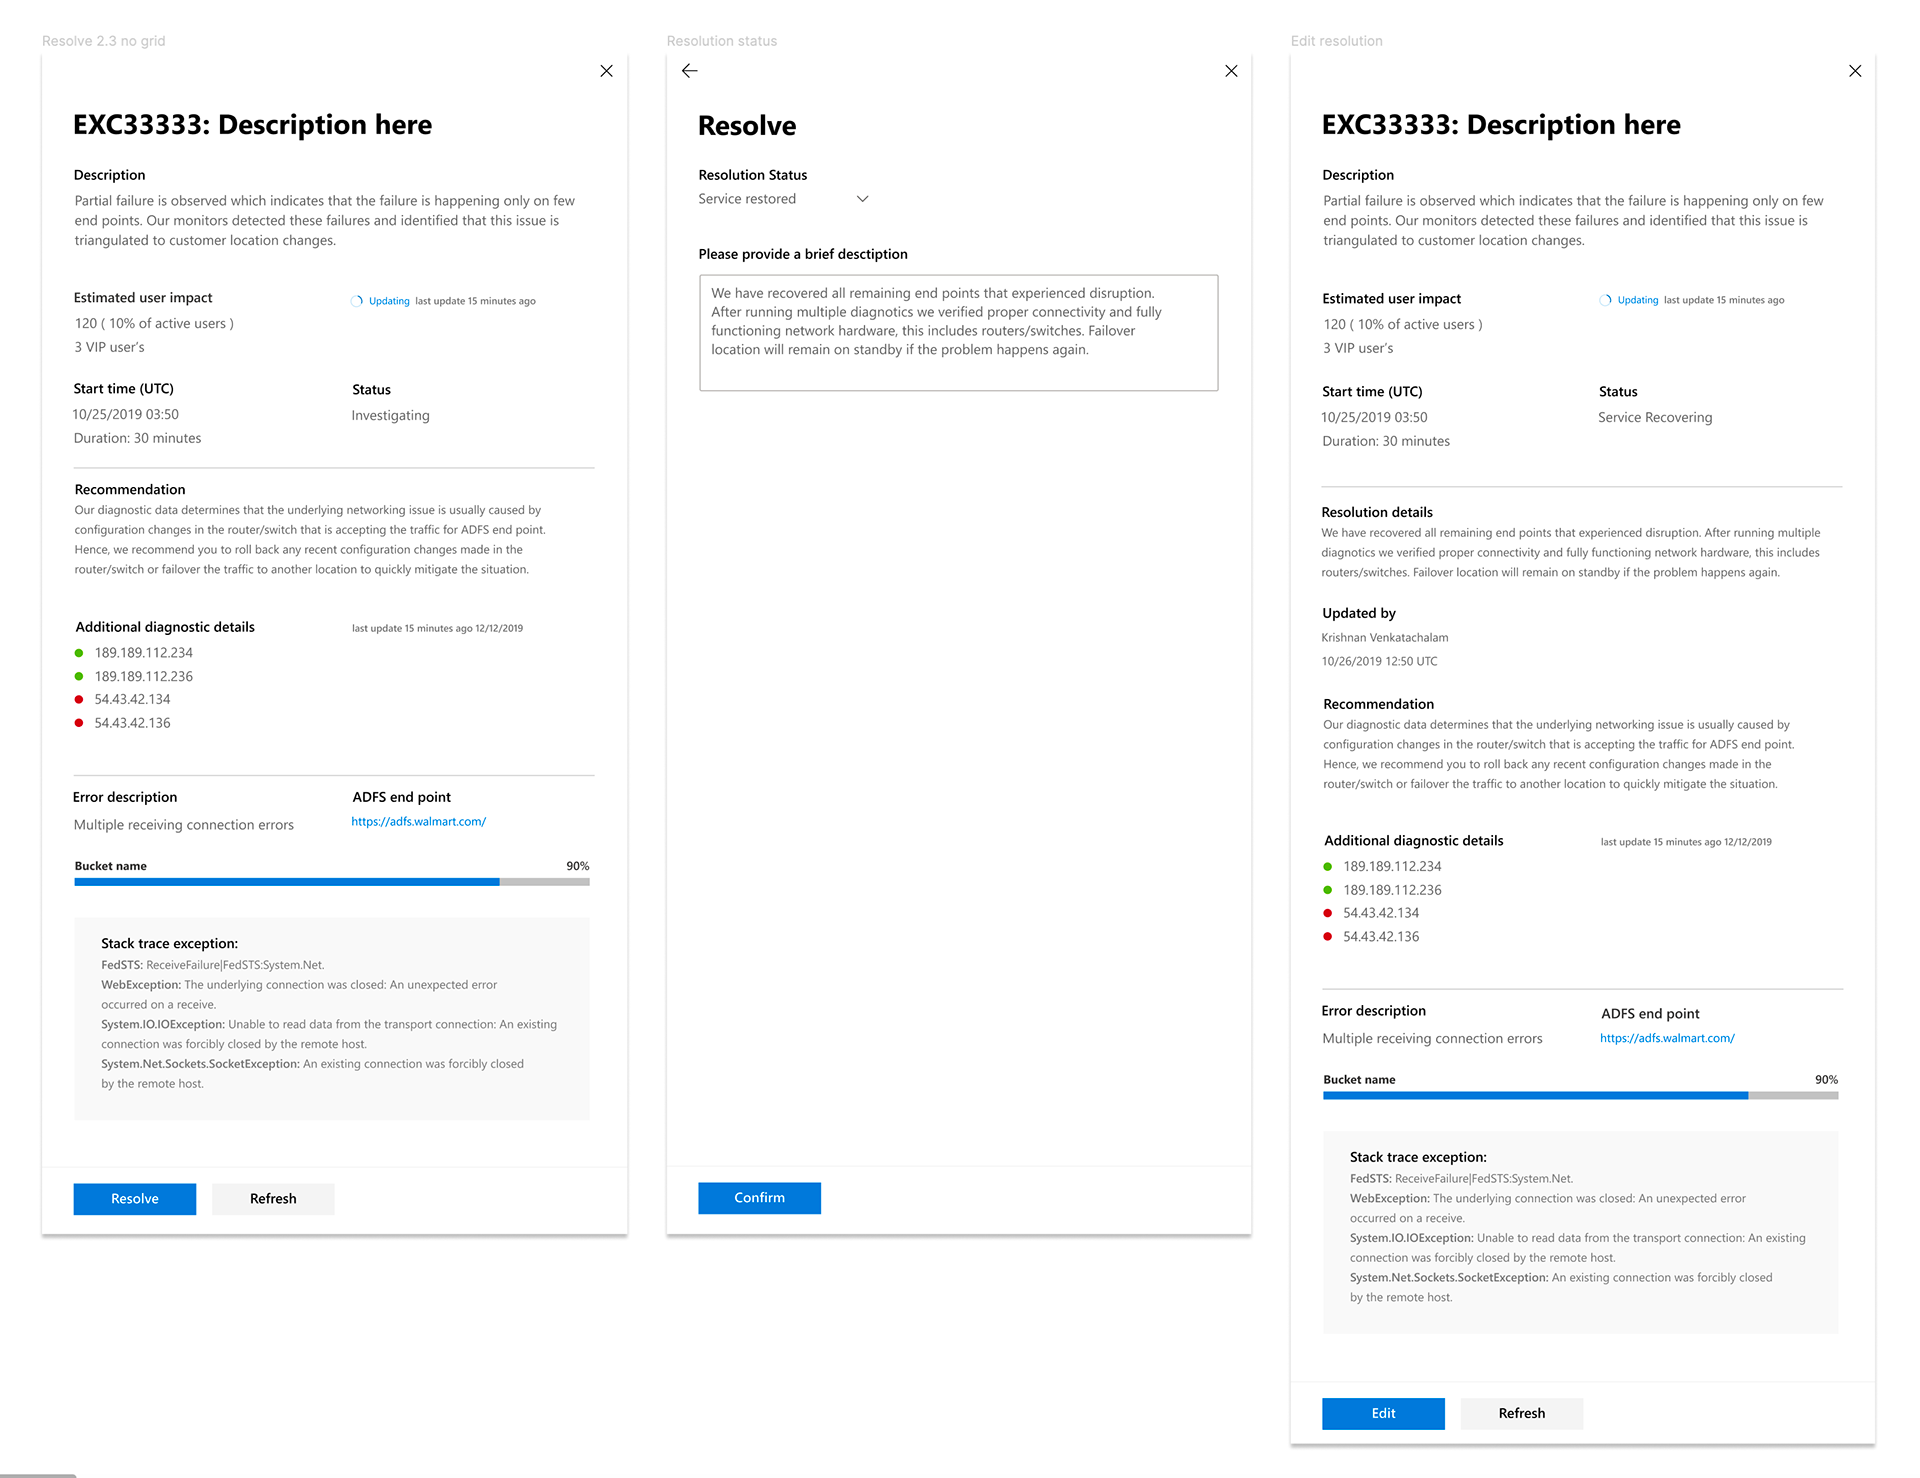
Incident cards
The incident card brings together a problem description, AI-assisted impact estimates, timestamps, and investigation updates. Its available actions change with the status. The design keeps the current information and the next step together as the investigation develops.
02
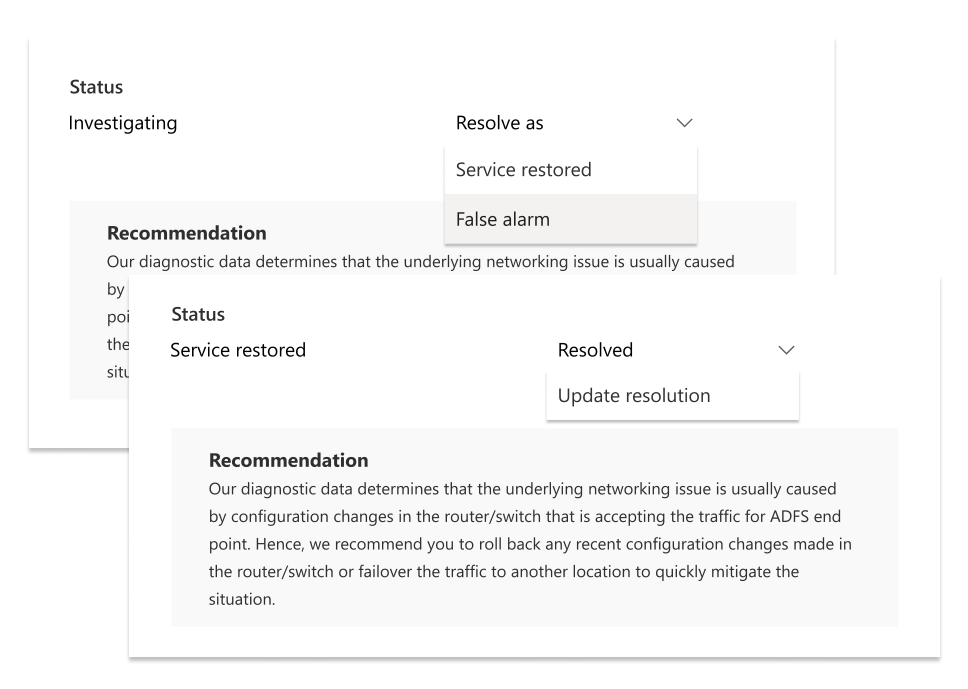
Advisories that users can act on
The advisory flow distinguishes the responsibility for the next step. Tenant-level problems can include actions the admin can take. Microsoft-level incidents show information about repair work in progress. This gives admins a way to understand both what they can do and which updates they need to follow.
03
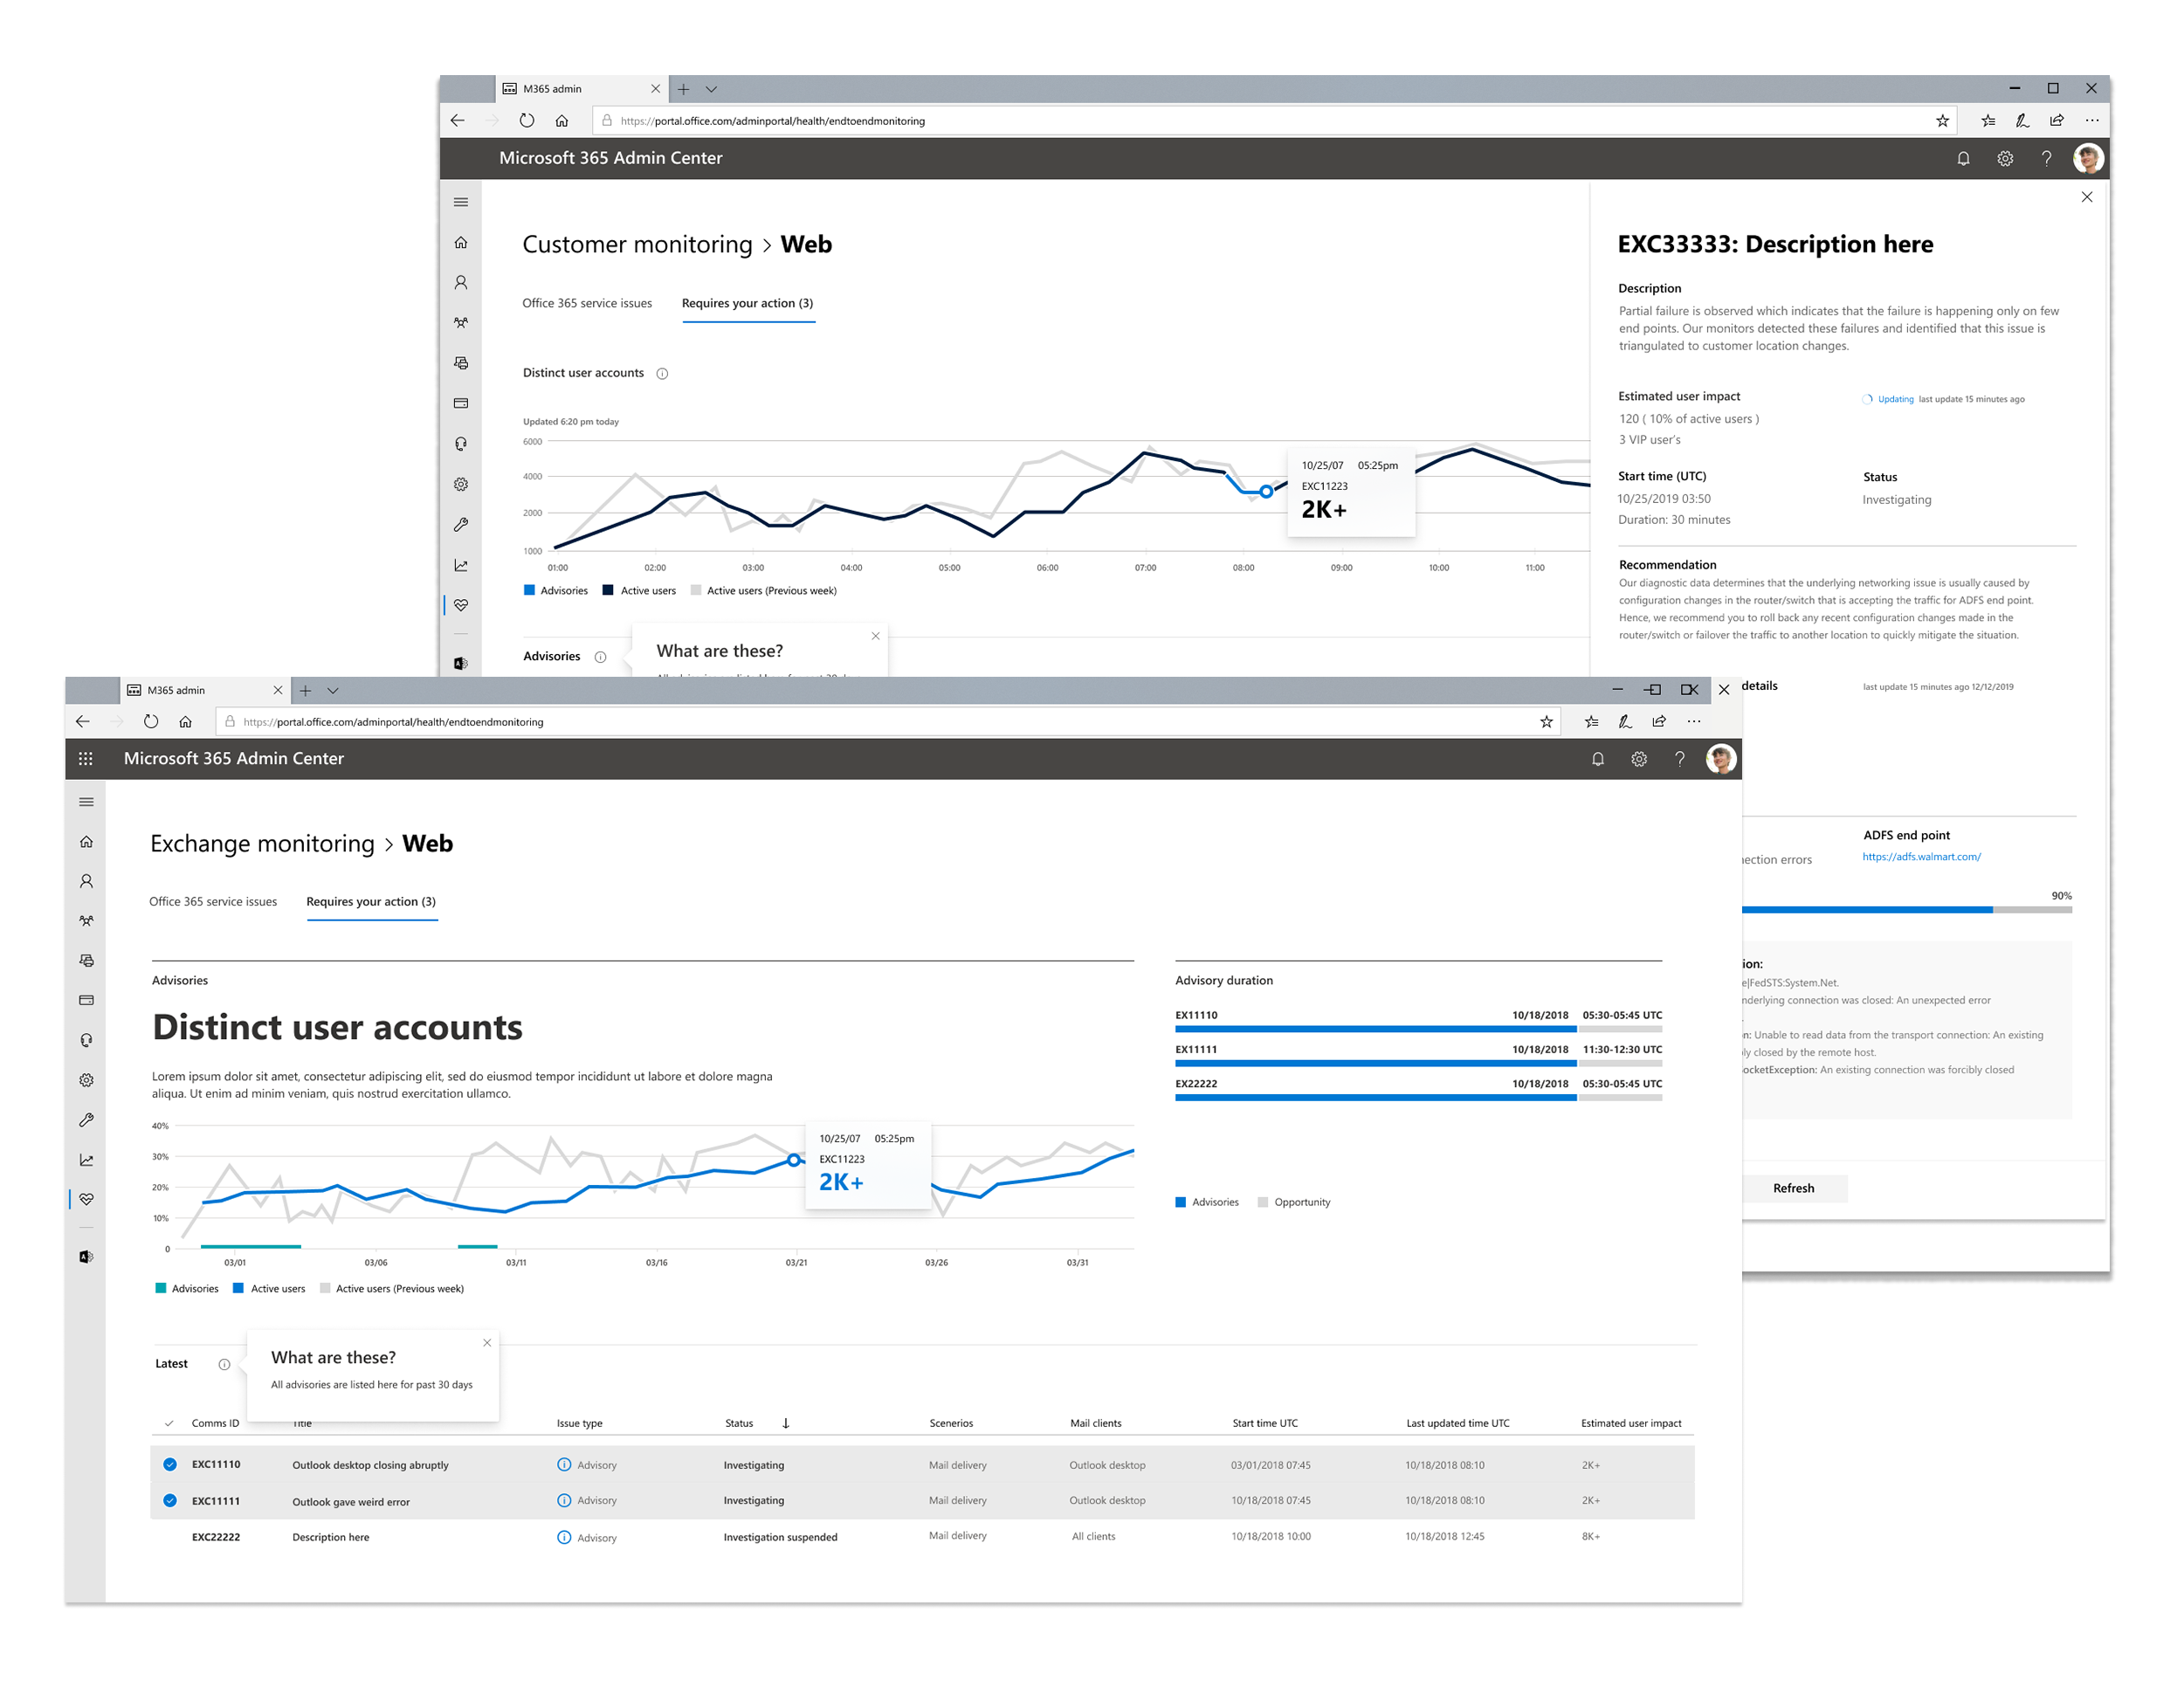
Compare how many people are affected and for how long
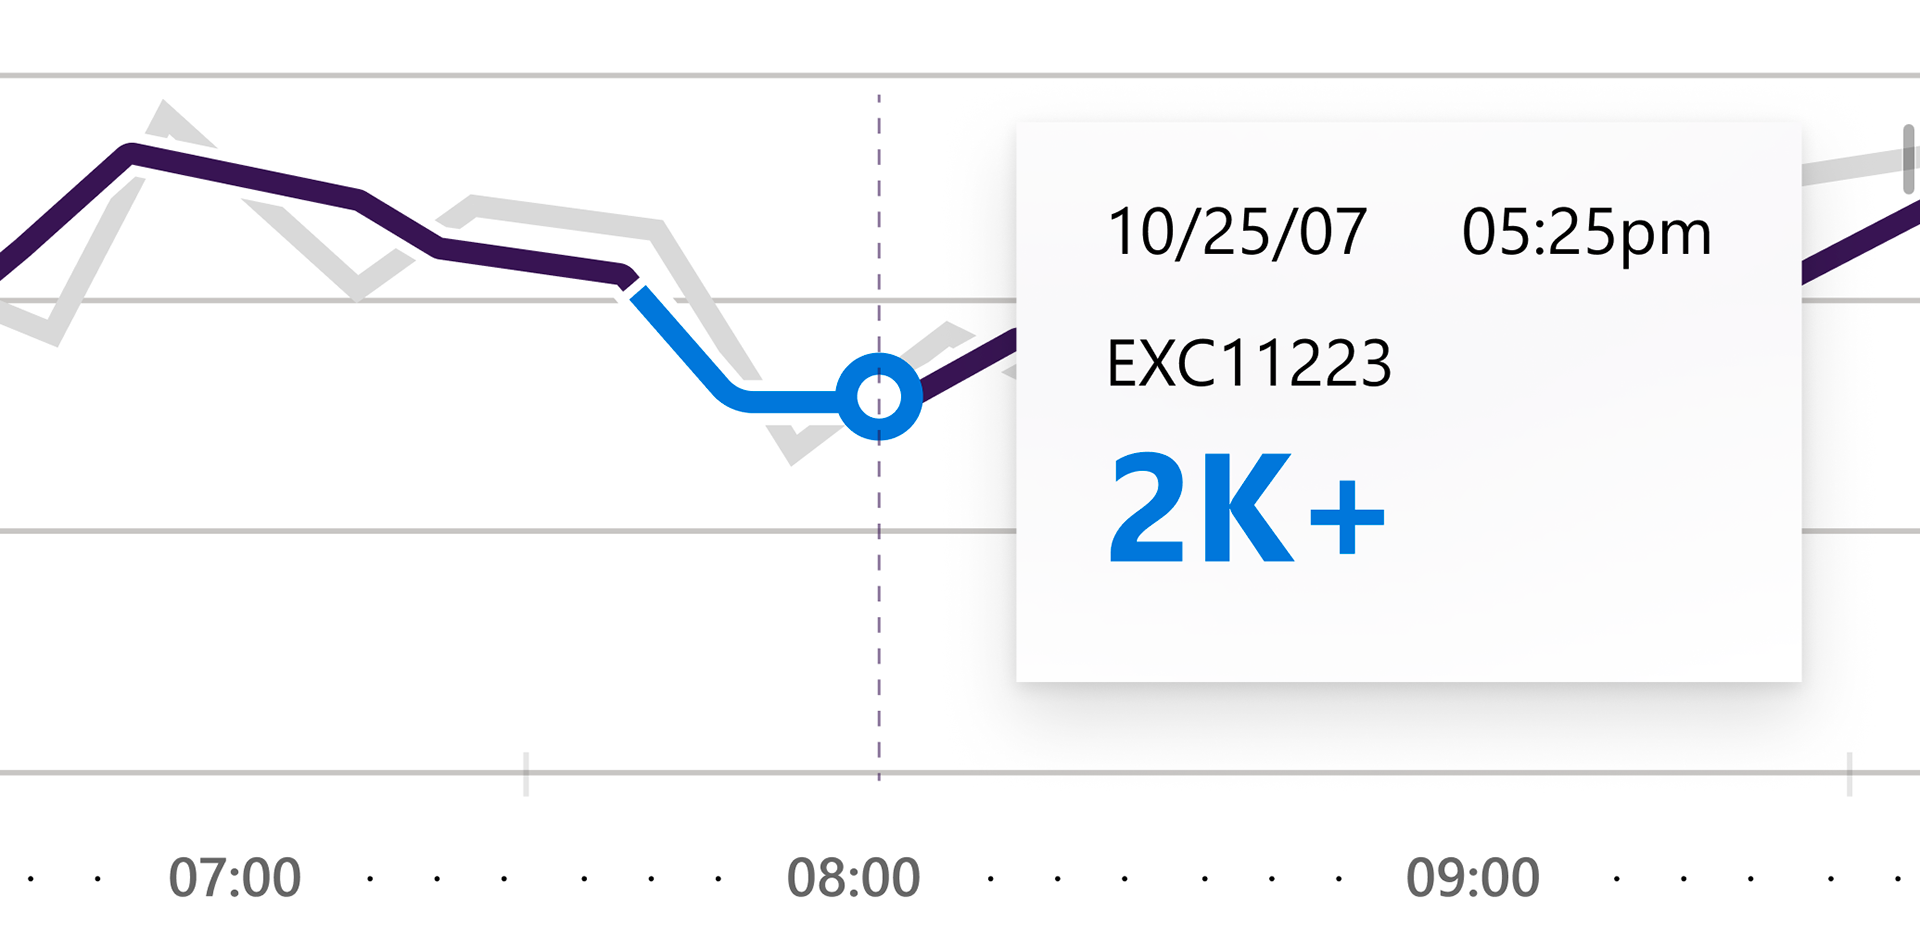
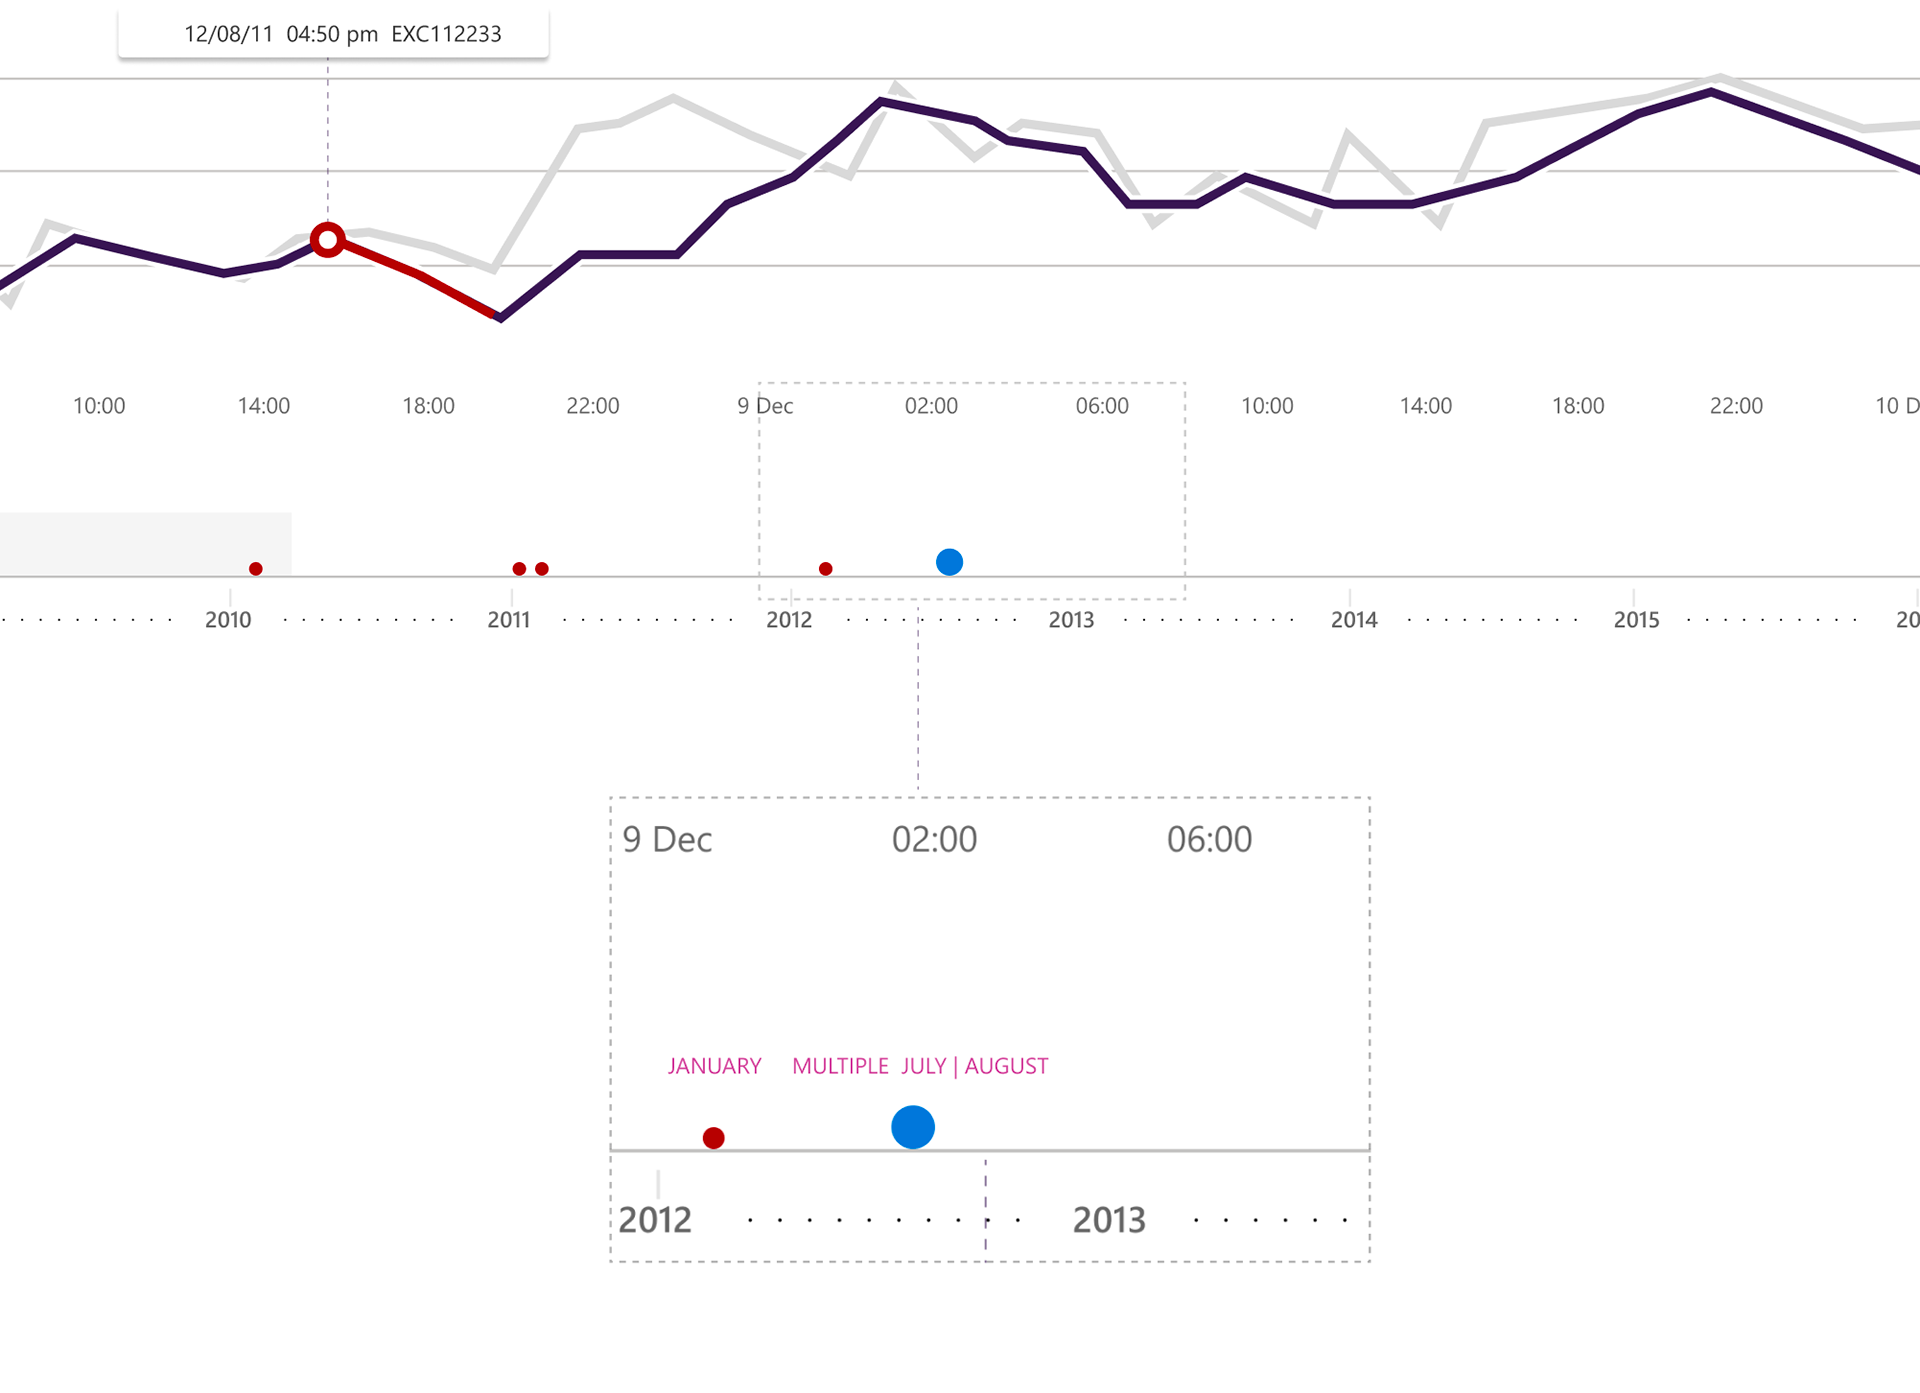
The chart presents affected-user count and duration of impact together. Named series distinguish the measures, and hover reveals point details. The design gives admins an overview of the incident window with a way to examine a particular moment.
04
Get the right updates to the right admins
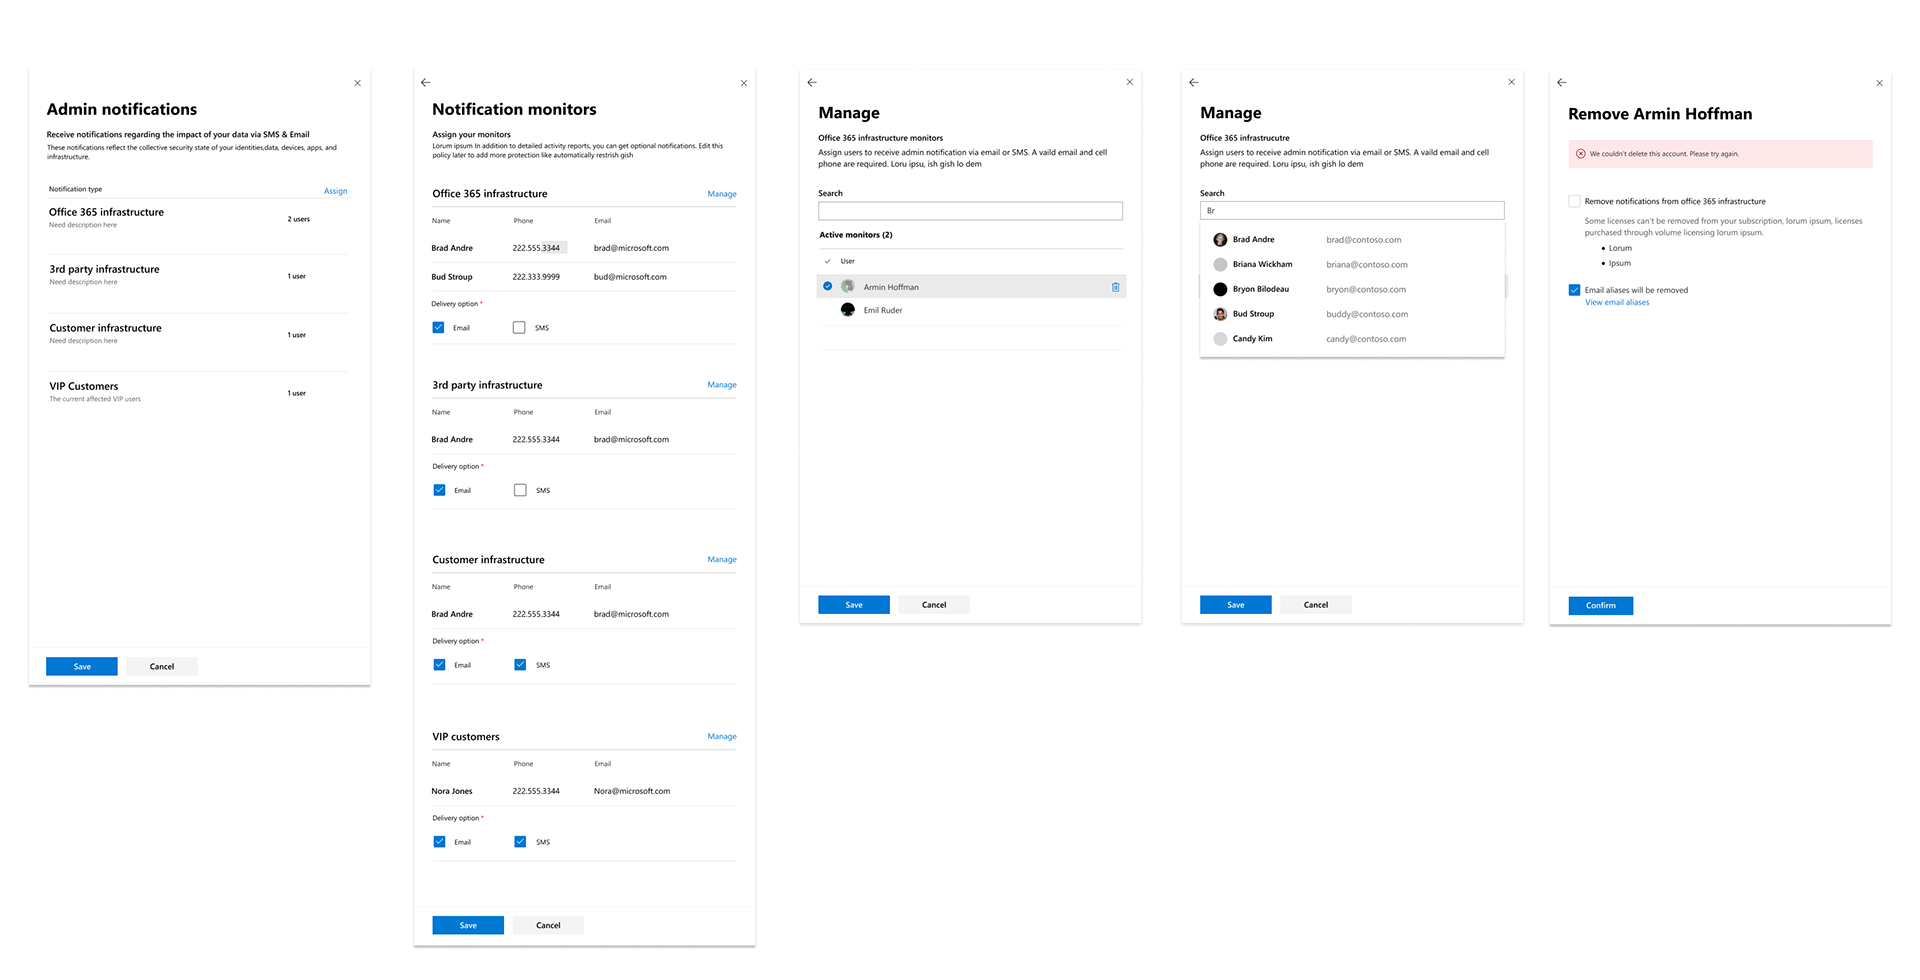
Monitoring only helps if the people responsible receive the update. The notification flow lets admins assign recipients to Office 365, third-party, and customer infrastructure groups, with a separate group for VIP customers. Email and SMS preferences sit alongside those assignments, making it clear who receives updates and how.
The design follows that setup through managing recipients, searching for someone to add, and confirming removal. It treats notification ownership as part of the incident workflow, so teams can maintain it as responsibilities change.
05
Bring Outlook crash details into the investigation
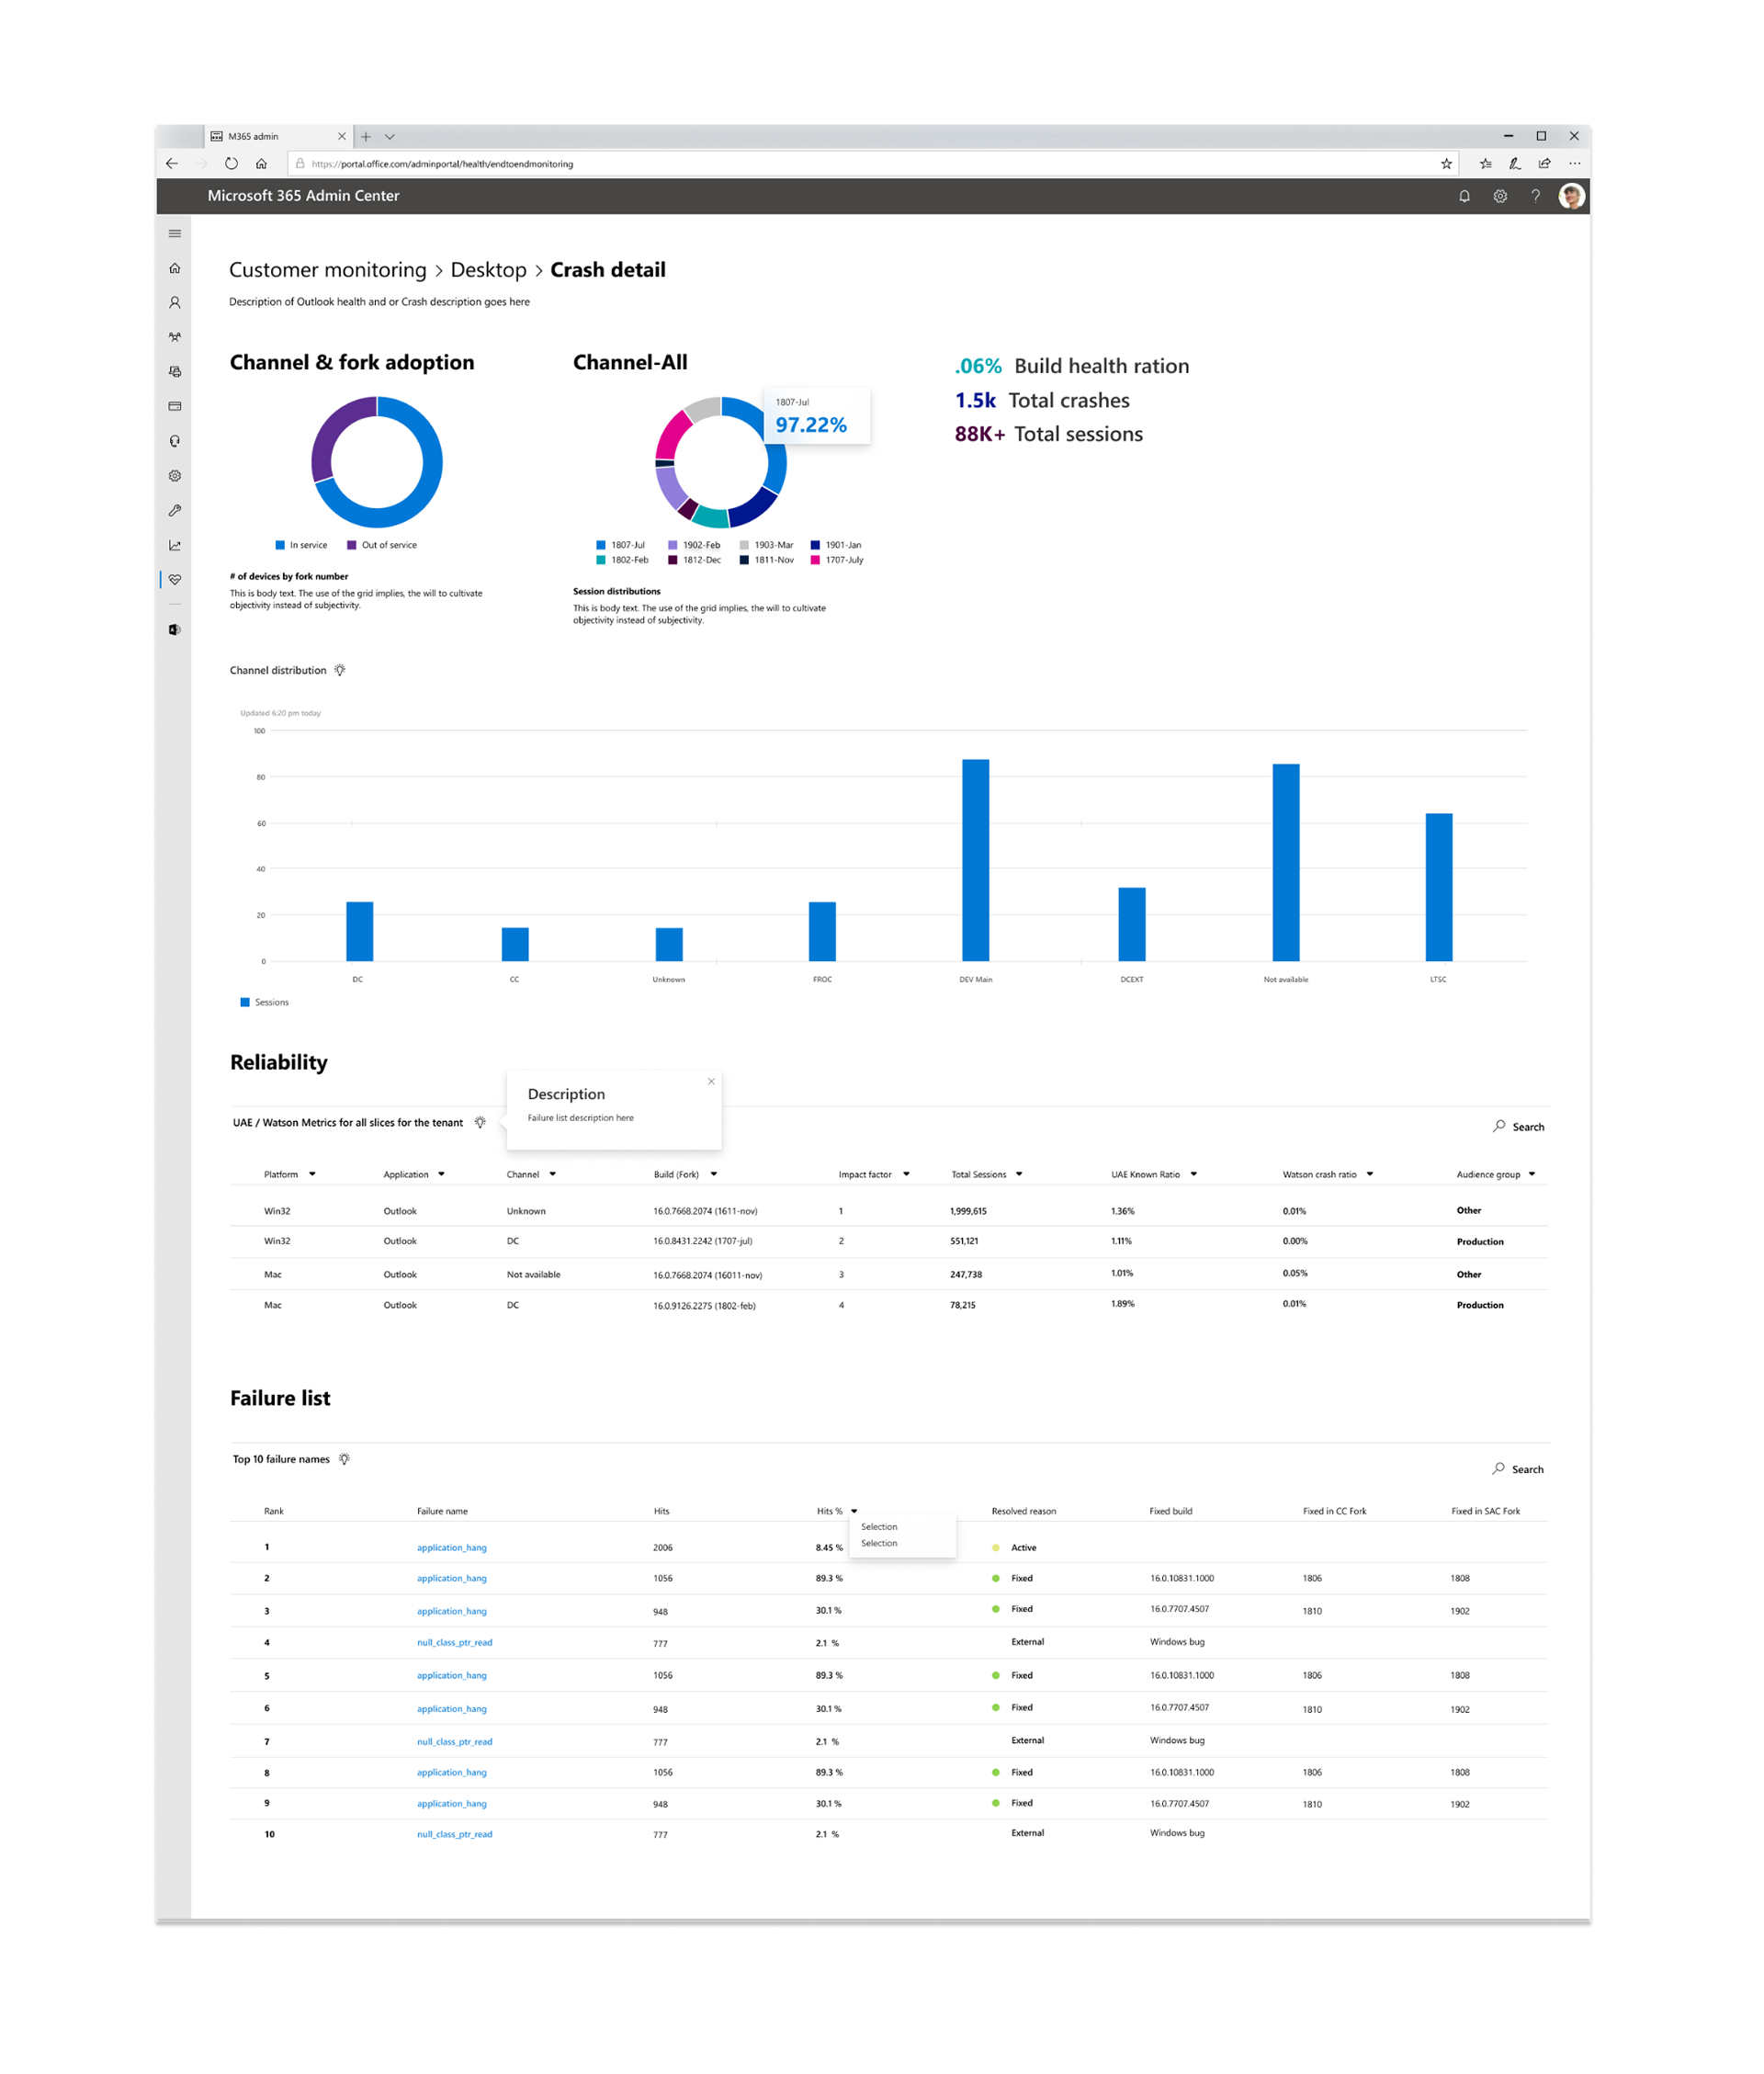
Working with the Outlook team, I explored how admins could investigate client crashes through the monitoring experience. The crash-detail view brings channel and build information, session counts, reliability measures, and a failure list together, giving admins context for narrowing down the affected environment.
06
Historic timelines
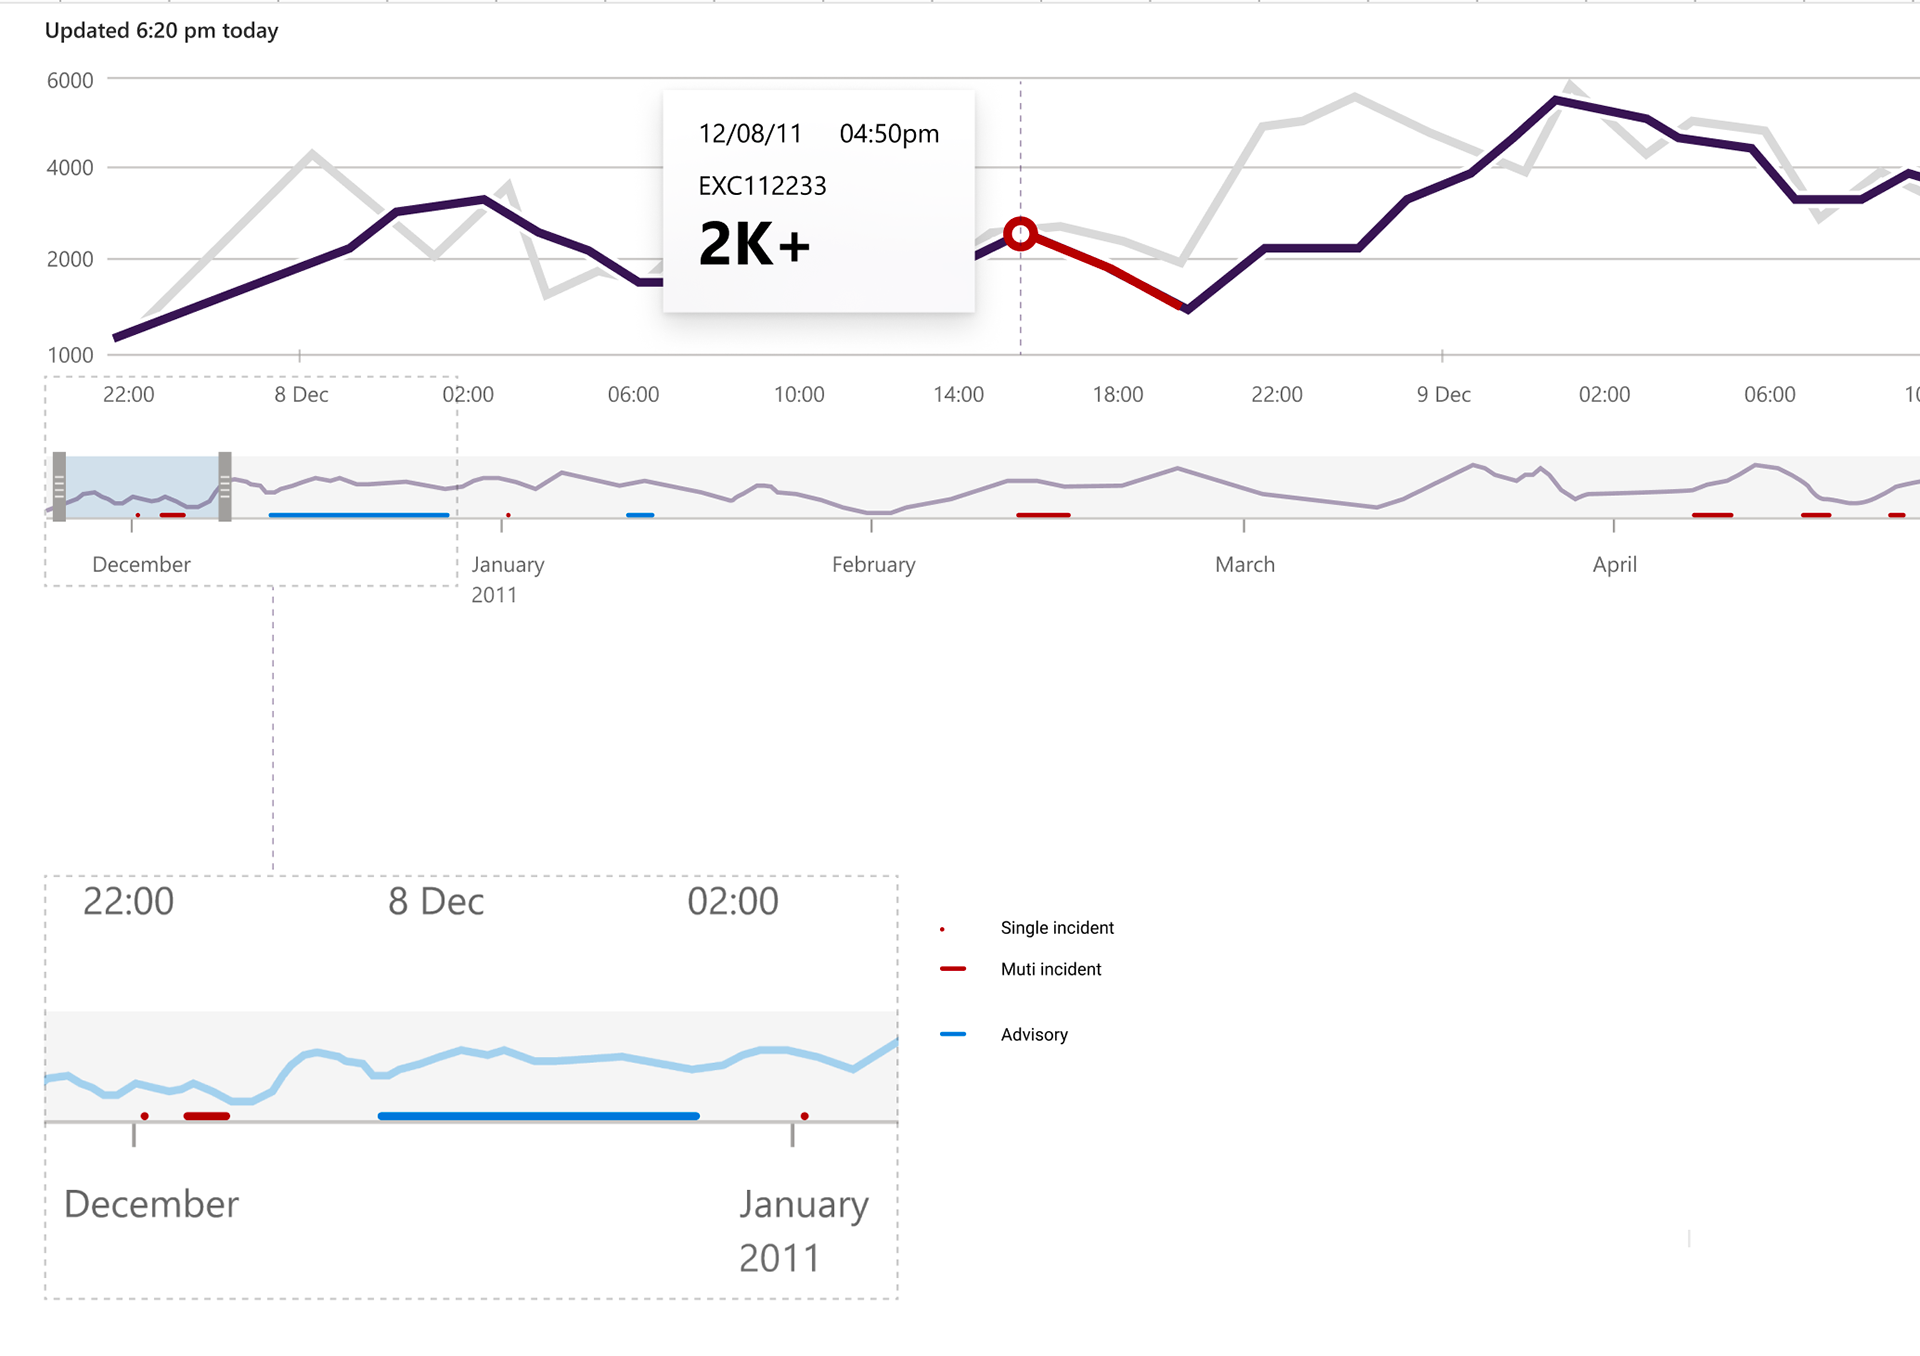
The historic timeline gives admins another view of an incident period. Incidents and advisories have named categories, with color separating them and larger marks representing stacked scenarios. The overview provides a way to locate activity over time and inspect a more detailed view.
Use prototypes to review the whole flow
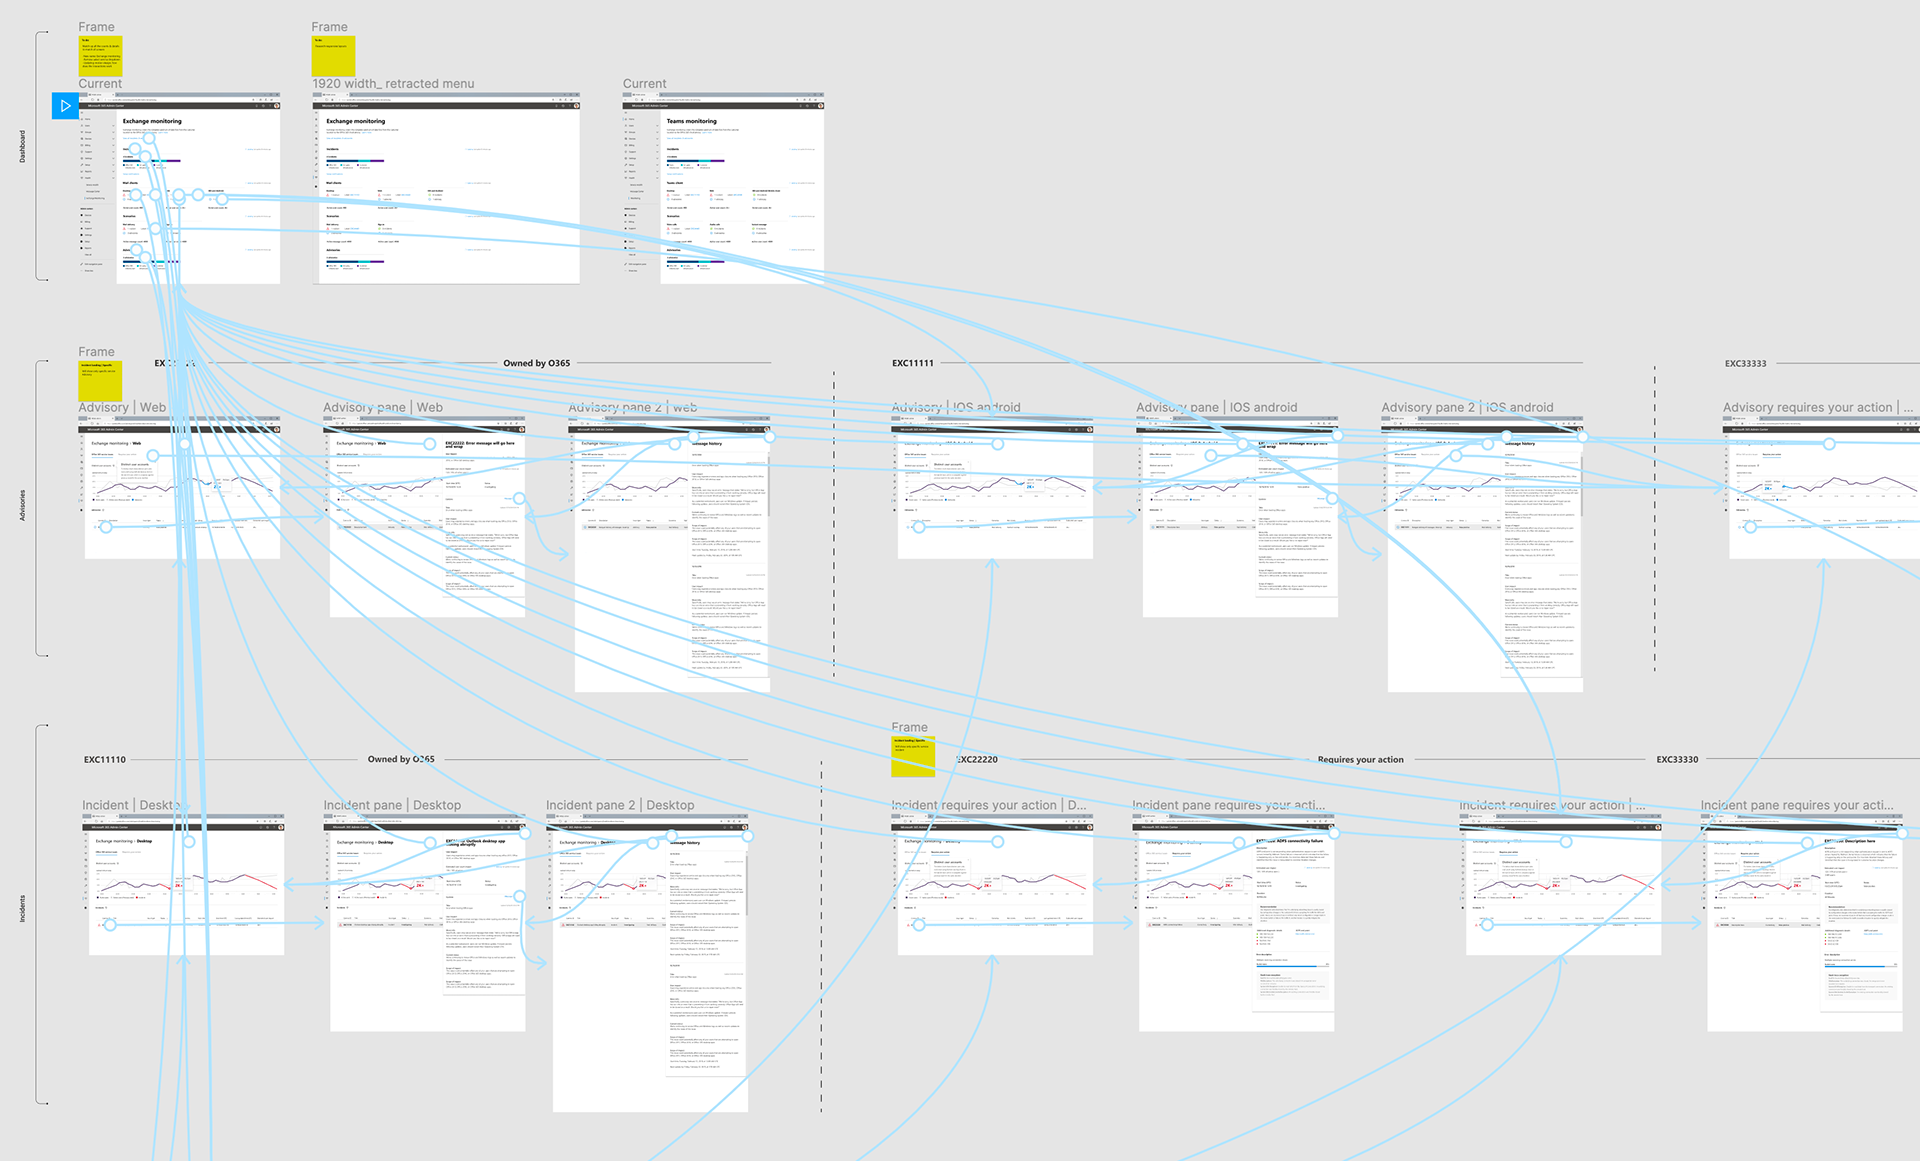
The prototypes included clickable flows, investigation states, conditional copy, and page transitions. Research participants and engineering partners could review how the experience changed through an investigation, rather than respond only to isolated screens.
Outcome · qualitative
Clearer infrastructure context, a more practical response
The work gave admins more insight into the infrastructure affected by an incident and a more practical path to remediation. Keeping the recommendation with the incident details helped connect monitoring information to the work of managing the issue.
Design-system context
M365 used a design system that was still in its infancy when I joined the project. I worked closely with the M365 design team as that foundation developed alongside the product work.